Mastodon Deep Lineage - a collection of plugins to analyse lineages of tracked objects in Mastodon
Installation instructions
Add the listed Mastodon update site in Fiji:
Help > Update > Manage update sites
Name: Mastodon

Add the unlisted Mastodon Deep Lineage update site in Fiji:
Help > Update > Manage update sites > Add Unlisted Site
Name: Mastodon-DeepLineage
URL: https://sites.imagej.net/Mastodon-DeepLineage/

Numerical Features added to Mastodon
Spot Features
Feature name |
Projections |
Description |
Formula/Visualisation |
|---|---|---|---|
Spot Ellipsoid |
Short semi axes, Middle semi axis, Long semi axis |
The ellipsoid semi axes in ascending order of length. |
The semi axes are computed applying the square root to the eigenvalues of the so-called covariance matrix of the spots |
Volume |
The volume of the ellipsoid. |
$V=\frac{4}{3} \pi a b c$ |
|
Spot Ellipsoid Aspect Ratios |
Aspect ratio short to middle |
The ratio between the short axis and middle axis. |
$\frac{\text{short axis}}{\text{middle axis}}$ |
Aspect ratio short to long |
The ratio between the short axis and long axis. |
$\frac{\text{short axis}}{\text{long axis}}$ |
|
Aspect ratio middle to long |
The ratio between the middle axis and long axis. |
$\frac{\text{middle axis}}{\text{long axis}}$ |
|
Spot Branch ID |
idem |
The ID of the branch spot each spot belongs to. |
Branch-spot features
Feature name |
Projections |
Description |
Formula/Visualisation |
|---|---|---|---|
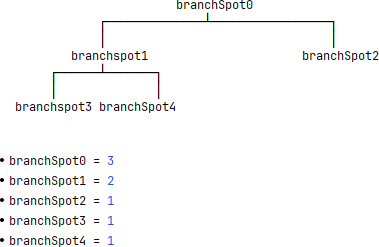
Branch N Leaves |
idem |
The total number of leaves of a branch spot in the whole track subtree of this branch spot. |
|
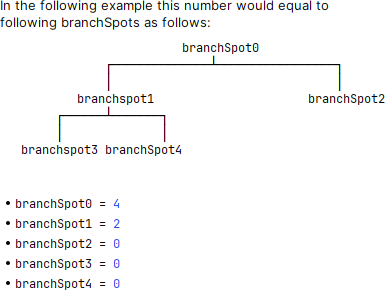
Branch N Successor |
idem |
Total number of successors of a branch spot in the whole track subtree of this branch spot. |
|
Branch Sinuosity |
idem |
Computes the sinuosity of a spot during its life cycle (cf. Sinuosity), i.e. how much the track represented by the branch is curved. Values close to 1: almost straight movement. Values significantly higher than 1: winding or meandering movement. |
|
Lineage Tree Classification
This plugin is capable of grouping similar lineage trees together.
The similarity of a pair of lineage trees is computed based on the Zhang edit distance for unordered trees (Zhang, K. Algorithmica 15, 205–222, 1996). This method captures the cost of the transformation of one tree into the other.
The cost function applied for the tree edit distance uses the attribute branch spot duration, which is computed as a difference of time points between to subsequent divisions reflecting the start and the end of a spot’s lifetime.
Thus, the linage classification operates on Mastodon’s branch graph.
The Zhang unordered edit distance allows the following edit operations:
  Note: The prefix T may represent a node or a complete subtree. Nodes without this prefix are just nodes.

  1. Change label
        A         A'
       / \  ->   / \
      TB TC     TB TC


  2a: Remove subtree (opposite of 2b)
         A         A
        / \   ->   |
       TB TC       TB

  2b: Add new subtree (opposite of 2a)

        A          A
        |    ->   / \
        TB       TB TC


  3a: Remove subtree but keep one child (opposite of 3b)

         A          A
        / \   ->   / \
       B  TC      TD TC
      / \
     TD TE        (remove B and TE, keep TD)

  3b: Convert existing subtree into child of a newly inserted subtree (opposite of 3a)
         A             A
        / \    ->     / \
       TB TC         D  TC
                    / \
                   TB TE       (insert D and TE, keep TB)


  4a: Remove subtree (and siblings) but keep all children (opposite of 4b)
         A               A
        / \             / \
       B  TC   ->      TD TE
      / \
     TD TE            (Subtree B and it's sibling TC are removed, but the children
                       of B namely TD and TE are kept)

  4b: Convert existing subtrees into children of a newly inserted subtree (opposite of 4a)
         A               A
        / \             / \
       TB TC   ->      D  TE
                      / \
                     TB TC       (Subtree D and it's sibling TE are newly inserted,
                                  TB and TC are kept as children of D)
A basic example of the tree edit distance:
Tree1
	                        node1(node_weight=13)
	               ┌──────────┴─────────────┐
	               │                        │
	             node2(node_weight=203)   node3(node_weight=203)
Tree2
	                        node1(node_weight=12)
	               ┌──────────┴─────────────┐
	               │                        │
	             node2(node_weight=227)   node3(node_weight=227)
	                             ┌──────────┴─────────────┐
	                           node4(node_weight=10)    node5(node_weight=10)
Edit distance of 69, because:
one node has a difference of 1
two nodes have a difference of 24 each
two extra nodes are added with a weight of 10 each
$\text{Zhang Tree Edit Distance}_{Tree1,Tree2} = 1 + 2 \times 24 + 2 \times 10 = 69$
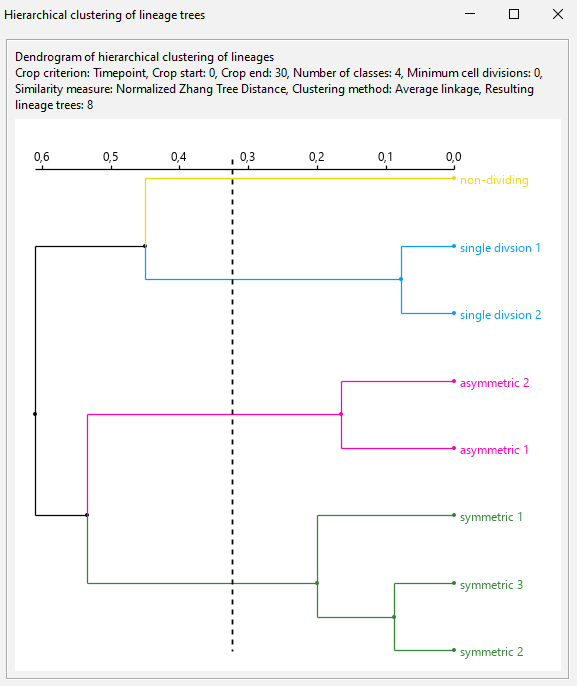
The tree edit distances are computed between all possible combinations of lineage trees leading to a two-dimensional matrix. The values in this matrix are considered to reflect similarities of lineage trees. Low tree edit distances represent a high similarity between a discrete pair of lineage trees.
This similarity matrix is then used to perform an agglomerative hierarchical clustering into a specifiable number of classes.
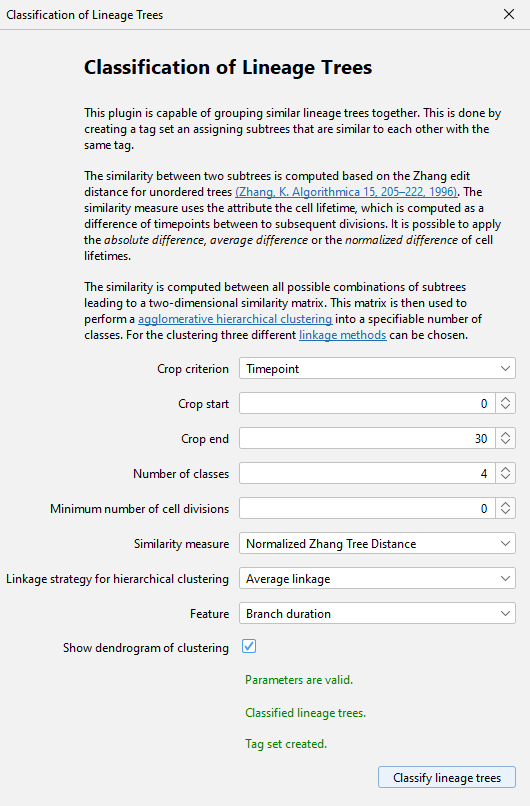
Parameters:
Crop criterion:
Time point (default)
Number of spots
Crop start
Crop end
Number of classes (minimum 2)
Minimum number of divisions
Similarity measure:
Normalized Zhang Tree Edit Distance (default). $\frac{distance_{treeA,treeB}}{distance_{treeA,emptyTree} + distance_ {treeB,emptyTree}}$
Per Branch Spot Zhang Tree Edit Distance. $\frac{distance_{treeA,treeB}}{numBranchSpotsA + numBranchSpotsB}$
Zhang Tree Edit Distance as described in (Zhang).
Linkage strategy for hierarchical clustering, cf. linkage methods
Average (default)
Single
Complete
Feature:
Branch duration (default and currently only selectable feature)
Show dendrogram of clustering
Example:
Demo data: Example data set
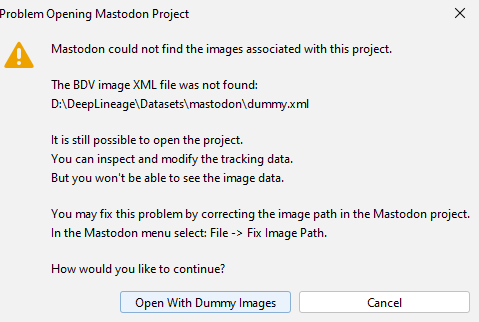
The demo data does not contain any image data.
The spatial positions of the spots are randomly generated.
When opening the dataset, you should confirm that you open the project with dummy images.
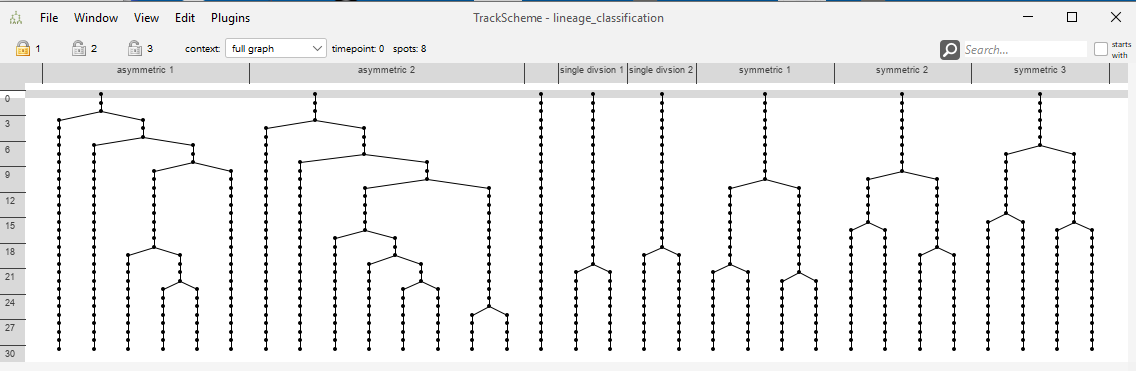
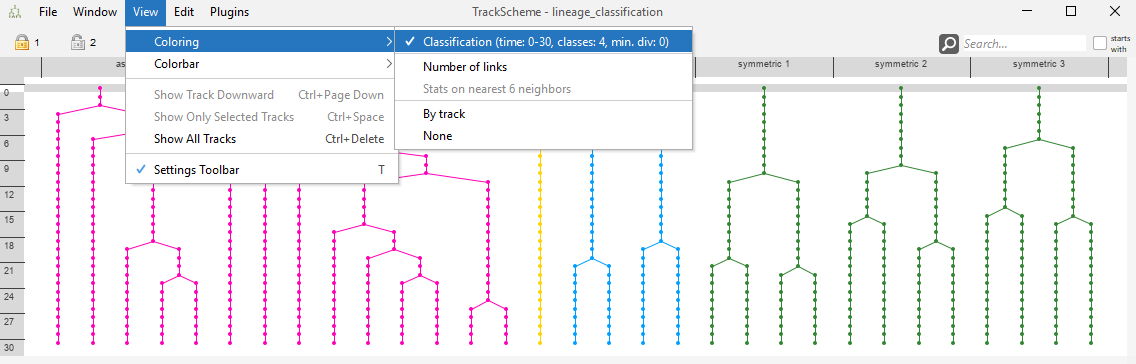
The track scheme of the demo data containing 8 lineage tree in total. You may see that the “symmetric”, the “ asymmetric” and the “single division” trees look similar to each other, but dissimilar to the other trees.
The lineage classification dialog.
The resulting dendrogram.
The resulting tag set used for coloring the track scheme.
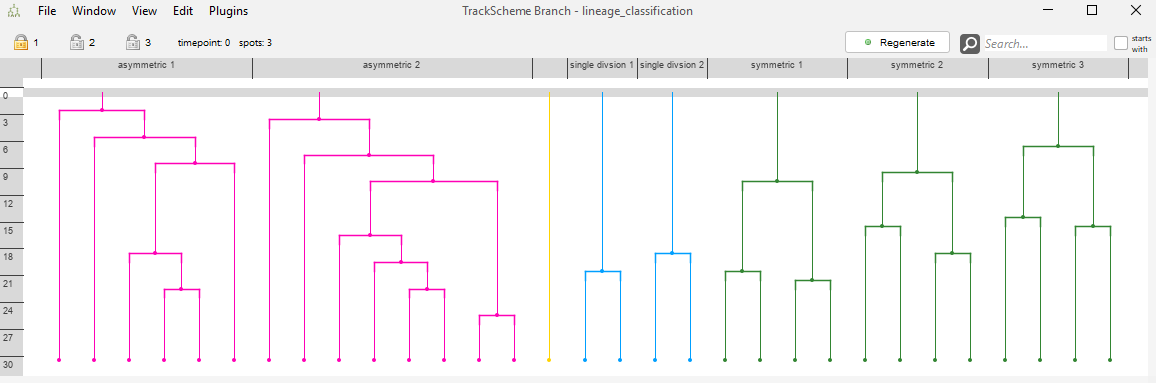
The resulting tag set used for coloring the track scheme branch view.
Label image exporter
The Label image exporter is capable of saving a label image to a file using the existing ellipsoids in Mastodon.
For the labels, the spot ids, branch spot ids or the track ids that correspond to the spots / ellipsoids may be used. Since these Ids are counted zero based in Mastodon, an offset of 1 is added to all Ids so that no label clashes with the background of zero.
The recommended export format is ‘*.tif’-files. However, it should work also for other formats supported by ImageJ.
The export uses an image with signed integer value space, thus the maximum allowed id is 2.147.483.646.
Exporter can be found here:
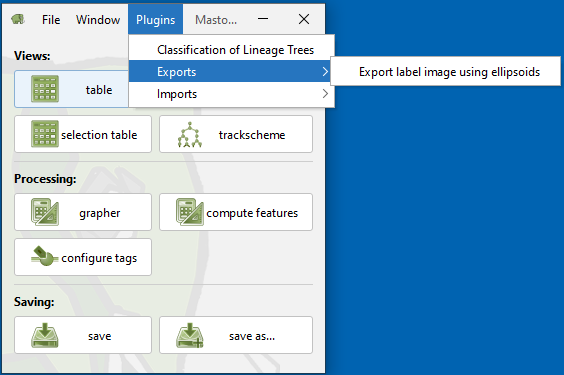
The dialog:
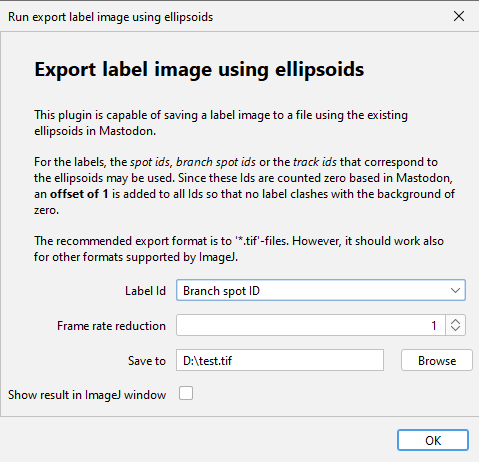
Label Id: The id that is used for the labels. The default is the Spot track Id.
The ids correspond to the highlighted columns in the feature table:
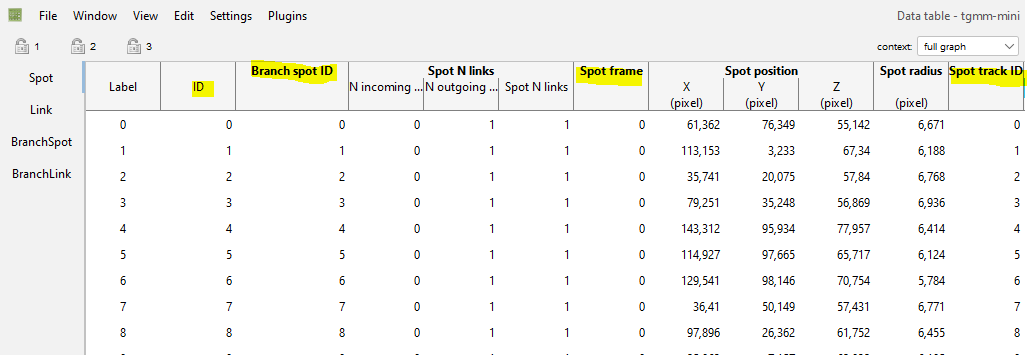
Frame rate reduction: Only export every n-th frame. 1 means no reduction. Value must be >= 1.
The frame number corresponds to the Spot frame column in the feature table.
Save to: Path to the file to save the label image to.
Example:
Demo data: Example data set
The timelapse with the ellipsoids in BigDataViewer:
The exported tif imported into Napari 3D view: