Hierarchical Clustering of Lineage Trees
Menu Location:
Plugins > Lineage Analysis > Hierarchical Clustering of Lineage TreesThis command is capable of grouping similar lineage trees together.
The linage clustering operates on Mastodon’s branch graph.
Lineage trees are considered similar, if they share a similar structure and thus represent a similar cell division pattern. The structure of a lineage tree is represented by the tree topology. This tree topology consists of the actual branching pattern and the cell lifetimes, i.e. the time points between two subsequent cell divisions.
Functionality in a nutshell:

Zhang Tree Edit Distance
The similarity of a pair of lineage trees is computed based on the Zhang edit distance for unordered trees (Zhang, K. Algorithmica 15, 205–222, 1996). This method captures the cost of the transformation of one tree into the other.
The Zhang unordered edit distance allows the following edit operations. The edit operations are defined in a way that they satisfy the constraints elaborated in section 3.1 (“Constrained Edit Distance Mappings”) of the paper: Zhang, K. Algorithmica 15, 205–222, 1996
  Note: The prefix T may represent a node or a complete subtree. Nodes without this prefix are just nodes.

  1. Change label

        A         A'
       / \  -->  / \
      TB TC     TB TC


  2a: Delete subtree (opposite of 2b)

        A         A
       / \   -->  |
      TB TC       TB

  2b: Insert subtree (opposite of 2a)

        A          A
        |    -->  / \
        TB       TB TC


  3a: Delete one child of a node and delete the node itself (opposite of 3b)

        A             A
       / \   -->     / \
      B  TC         TD TC
     / \
    TD TE        (delete TE and B, TD becomes child of A)

  3b: Insert a node and insert one child at that node (opposite of 3a)
        A            A
       / \     -->  / \
      TB TC         D  TC
                   / \
                  TB TE       (insert D and TE, TB becomes child of D)


  4a: Delete node and delete its sibling subtree (opposite of 4b)
        A               A
       / \             / \
      B  TC   -->     TD TE
     / \
    TD TE            (Node B and its sibling subtree TC are deleted and the children
                      of B, namely TD and TE, become the children of A)

  4b: Insert node and insert a sibling subtree (opposite of 4a)
        A               A
       / \             / \
      TB TC   -->     D  TE
                     / \
                    TB TC       (Node D and its sibling TE are inserted,
                                 TB and TC become the children of D)
As an example, the following case explicitly does not fulfill the constraints mentioned in the paper:
 Delete a node without deleting one of its children
          A            A
         / \   -->   / | \
        B  TC      TD TE TC
       / \
      TD TE        (delete B, TD and TE become children of A and TC remains)
A basic example of the tree edit distance:
Tree1
                            node1(node_weight=13)
                   ┌──────────┴─────────────┐
                   │                        │
                 node2(node_weight=203)   node3(node_weight=203)
Tree2
                            node1(node_weight=12)
                   ┌──────────┴─────────────┐
                   │                        │
                 node2(node_weight=227)   node3(node_weight=227)
                                 ┌──────────┴─────────────┐
                               node4(node_weight=10)    node5(node_weight=10)
Edit distance of 69, because:
one node has a difference of 1 (13-12)
two nodes have a difference of 24 each (227-203 * 2)
two extra nodes are added with a weight of 10 each (10 * 2)

Workflow
The similarity measure uses the attribute cell lifetime, which is computed as a difference of time points between two subsequent divisions. There are multiple ways to compute the similarity between two lineage trees based on this attribute:
The sum of the edit distances as shown in the basic example above. Individual differences in the cell lifetimes may be normalized by their sum (i.e. local normalization)
The sum of the edit distances as shown in the basic example above normalized by the maximum possible edit distances of the two trees (normalized zhang edit distance)
The sum of the edit distances normalized by the number of the involved nodes (per branch zhang edit distance)
The similarities are computed between all possible combinations of lineage trees leading to a two-dimensional similarity matrix. The values in this matrix are considered to reflect similarities of lineage trees. Low tree edit distances represent a high similarity between a discrete pair of lineage trees. This matrix is then used to perform an Agglomerative Hierarchical Clustering into a specifiable number of groups.
For the clustering three different linkage methods can be chosen.
Parameters
Crop criterion:
The criterion for cropping the lineage trees
Number of spots (default)
Time point
Crop start
At which number of spots / time point (depending on the chose crop criterion) the analysis should start
Crop end
At which number of spots / time point (depending on the chose crop criterion) the analysis should end
Number of clusters
How many groups the lineage trees should be assigned to by the clustering
Must not be greater than the number of valid lineage trees
Minimum number of divisions
The minimum number of divisions a lineage tree should have so that it is included in the analysis
Similarity measures:
(default)
 1,2
1,2 1
1Zhang Tree Edit Distance1,2
1Local cost function:
2Local cost function with normalization:
Linkage strategy for hierarchical clustering, cf. linkage methods
Average (default)
Single
Complete
List of further projects
If you have multiple similar projects, you can add them here to get an average clustering taking all projects into account.
Mastodon projects can be added / removed using
“Add files…”
“Add folder content…”
“Remove selected”
“Clear list”
Drag and drop of files and folders
The name of the current open project is shown above the list. The current project is always included in the hierarchical clustering. It cannot be added to the list.
It is important that the names of the roots of lineages in all projects included in the hierarchical clustering are the same. Otherwise, the hierarchical clustering will not work.
The effect of adding further projects is that the similarity matrix is computed for each project separately and then averaged, resulting in a more robust hierarchical clustering.
Add generated tags to further projects
If checked, the tags generated by the hierarchical clustering are also added to the further projects.
Important note: this will write tags to these projects. Consider making a backup of the further projects before running the hierarchical clustering, if you choose this option.
Show dendrogram of hierarchical clustering of lineage trees
If checked, the dendrogram is shown after the hierarchical clustering
Check validity of parameters
Press this button to check, if with the current parameters a hierarchical clustering is possible
If the parameters are invalid, a message will appear with the reason(s)
Possible reasons for invalid parameters:
The number of clusters is greater than the number of valid lineage trees
The crop start is greater than the crop end
The crop end is greater than the maximum number of spots / time points
Further projects that are included in the hierarchical clustering could not be found / opened
Example
Demo data: Example data set
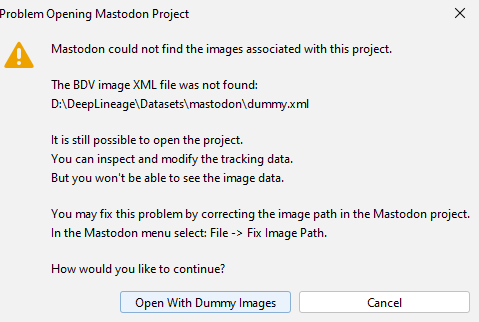
The demo data does not contain any image data.
The spatial positions of the spots are randomly generated.
When opening the dataset, you should confirm that you open the project with dummy images.
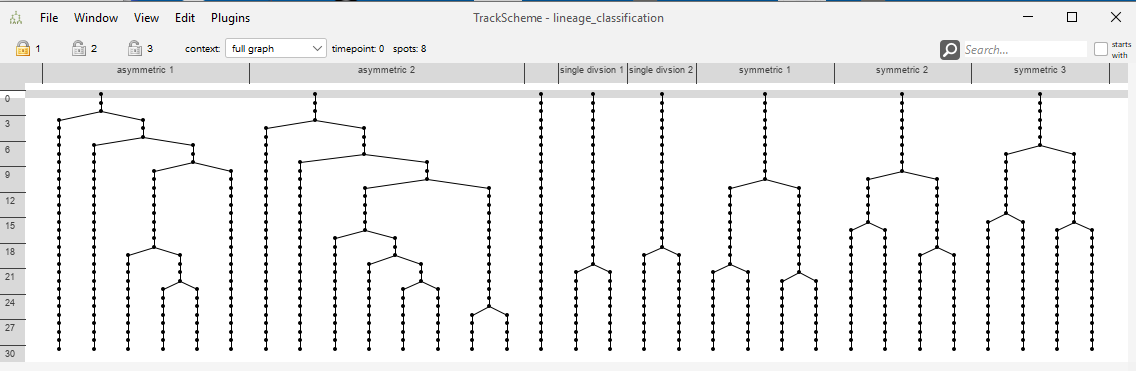
The track scheme of the demo data contains 8 lineage tree in total. You may see that the “symmetric”, the “asymmetric” and the “single division” trees look similar to each other, but dissimilar to the remaining trees.
The hierarchical clustering dialog.
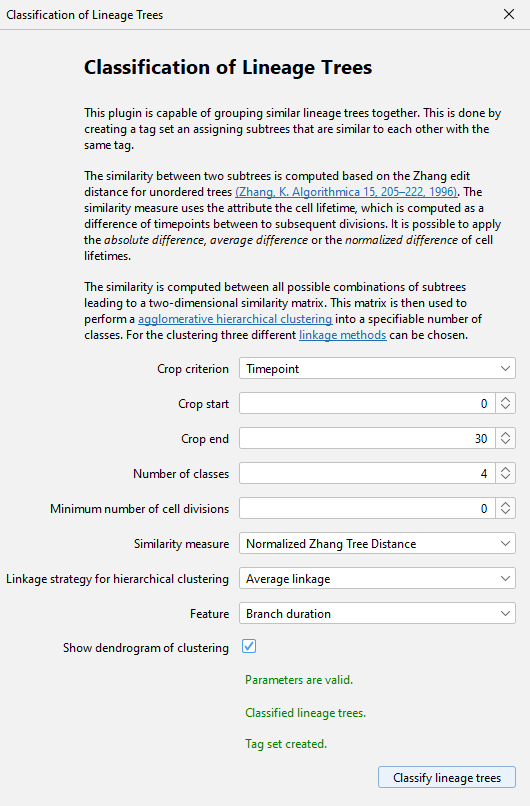
Cf. section Parameters for the meaning of the parameters.
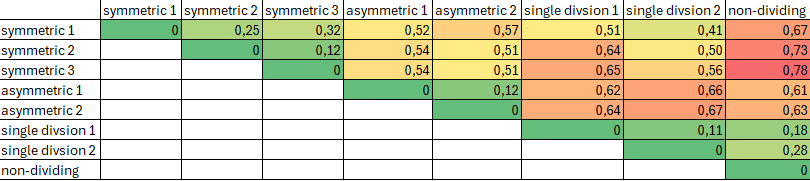
Not visible to the user, a similarity matrix is computed based on the chosen similarity measure. For the demo data, the matrix looks like this. Highly similar trees have low distances in this matrix.
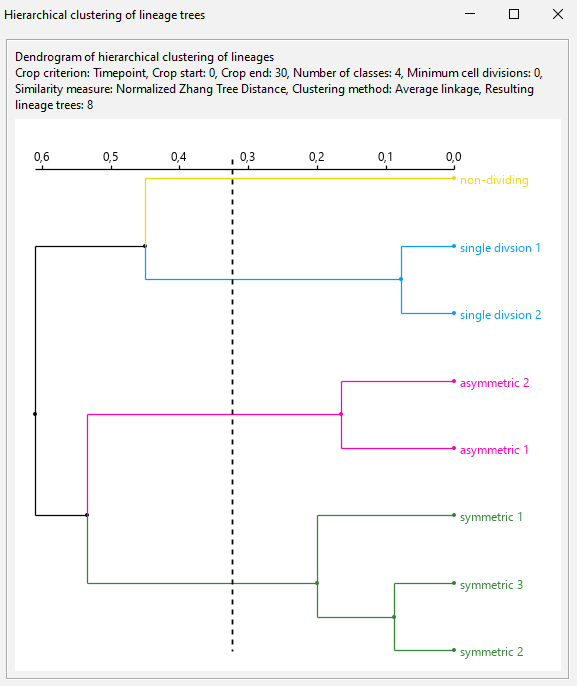
The resulting dendrogram.
User can toggle on/off root labels, tags, clustering threshold and median of the tree edit distances.
If the option
Show tag labelsis checked, the tag set shown in the dendrogram can be chosen.Export options for the dendrogram to SVG and PNG accessible via the context menu.
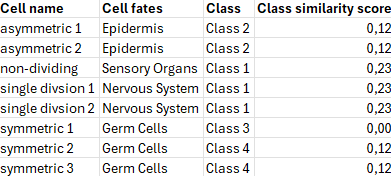
The result of the hierarchical clustering can be exported to a CSV file via the context menu. The exported file contains the root names of the lineage trees, the tag set value, the assigned group and the similarity score. The similarity score indicates how similar the lineage trees in this group are. The lower the score, the more similar the trees are.
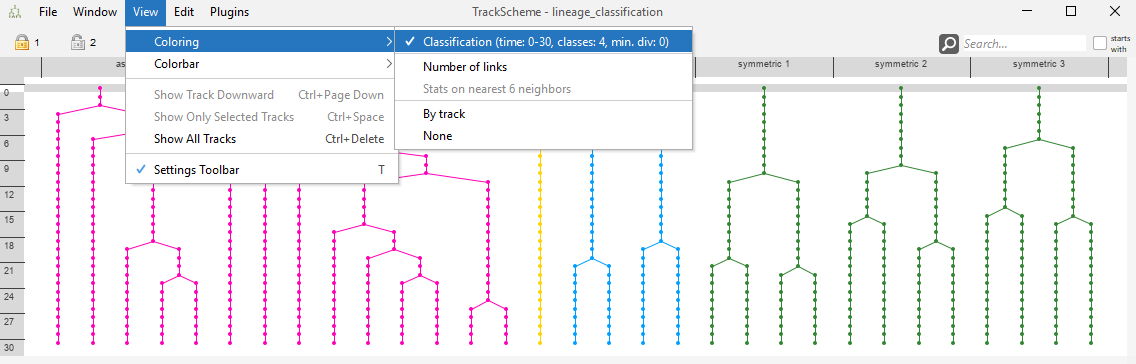
The resulting tag set may be used for coloring the track scheme.
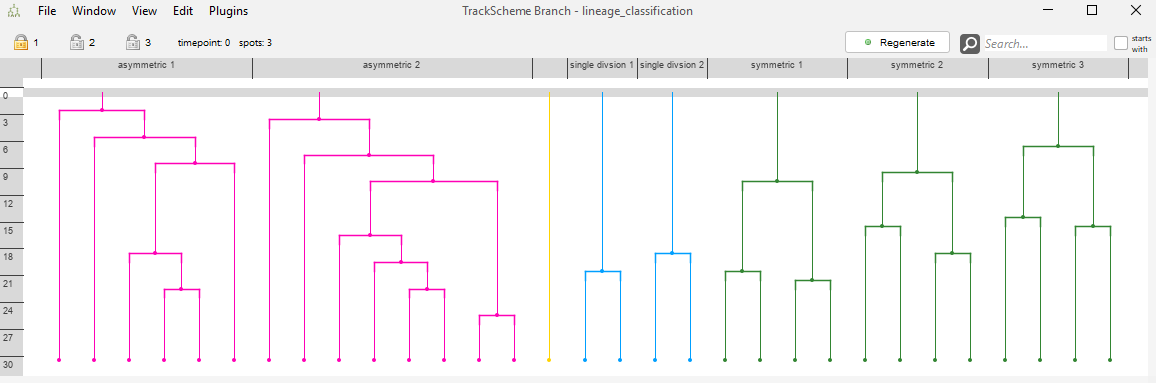
The resulting tag set may be used for coloring the track scheme branch view.
The resulting tag set may be used for coloring the spots in the BigDataViewer.