Usage
Blender View (Linked to Mastodon)
Menu Location:
Window > Blender Views > New Blender View (Linked to Mastodon)Before the Blender window opens, the user is asked to set a time scaling factor.
A time scaling factor of 1 means that there is no time scaling and the frame number in Big Data View / TrackScheme views matches the frame number in Blender.
A Time scaling factor larger than 1 means that interpolation between frames in the Blender view is computed, which leads to a smoother animation. Frame numbers in Blender are then multiplied by the time scaling factor.
Note: Interpolation may also happen in cases where spots of a track are not present in all frames. In this case, the positions of the missing spots are interpolated.
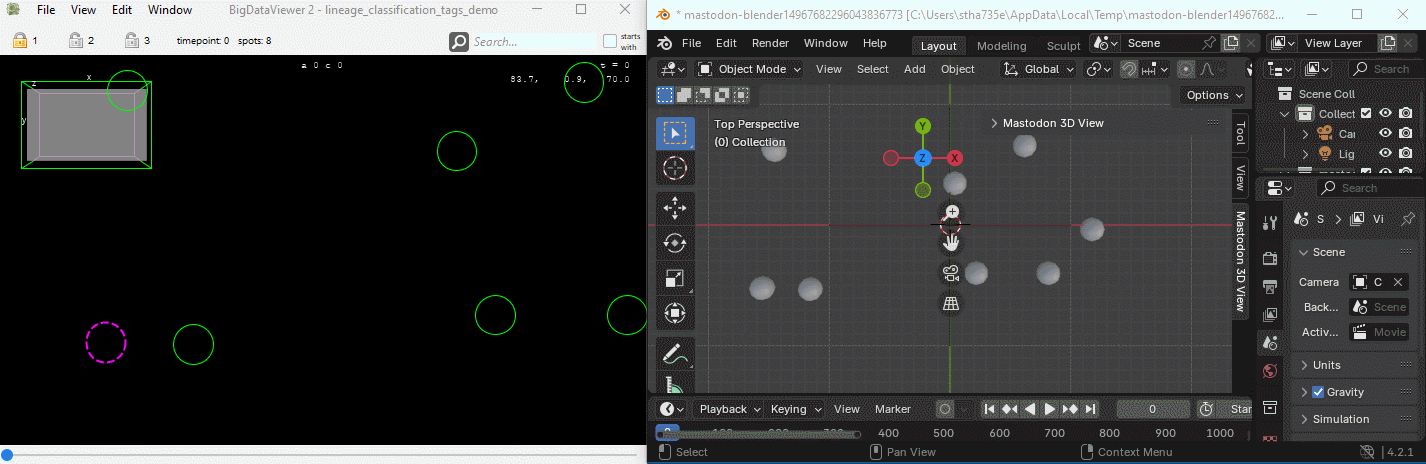
Example with a time scaling factor of 1:
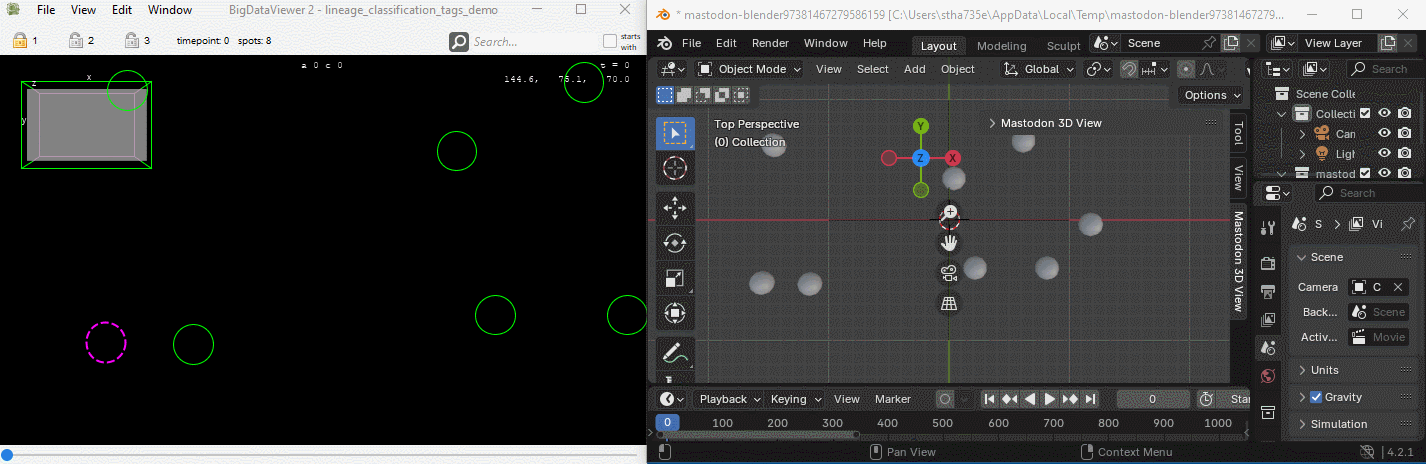
Example with a time scaling factor of 10:
Wait for some seconds for the data to load into Blender.
Play around!
“Mastodon 3D View” panel in Blender

Click on the 3D view in Blender.
Press
N, This makes a few tabs appear on the right edge of the 3D view.Alternatively, click the arrow on the right edge of the 3D view.
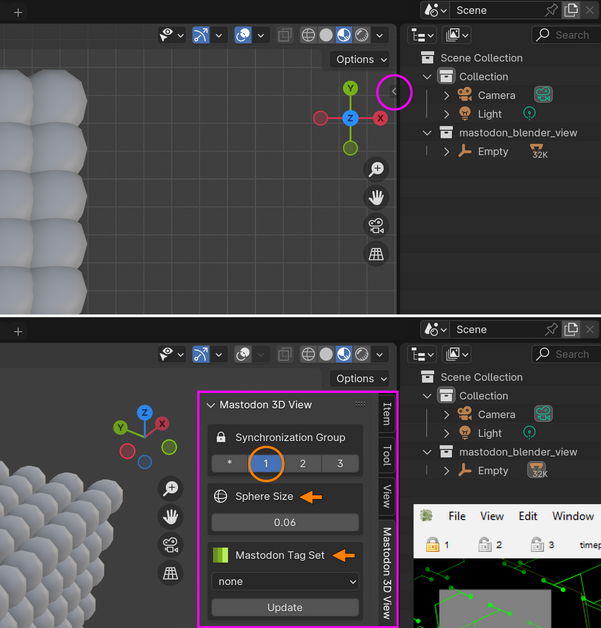
One of the tabs is called “Mastodon 3D View”.
Click it and you will be able to:
Select a Mastodon synchronization group
Change sphere sizes
Select a “tag set” (The colors will be visualized in the 3d view.)
Changes to Tag Sets or tag colors in Mastodon require updating via the
Updatebutton.Modifications to tracks (e.g., deletions or annotations) in Mastodon require launching a new Blender View window, as real-time updates are not supported.
Synchronize time-point and active spot between Mastodon and Blender
In the Mastodon TrackScheme window click one of the lock symbols 1, 2 or 3. In Blender go to the “Mastodon 3D View” panel, and choose the same number 1, 2 or 3 as “Synchronization Group”.


Now, the active time points and the active spot are synchronized between Blender and Mastodon.
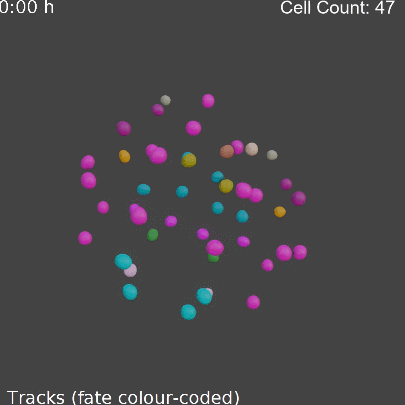
Example of a visualization
Blender View (Advanced Visuals)
Menu Location:
Window > Blender Views > New Blender View (Advanced Visuals)Choose the tag set or the feature color mode you want to use for visualization.

Wait for some seconds for the data to load into Blender.
Play around!
Note: In contrast to the “Linked to Mastodon” view, the “Advanced Visuals” view does not support the synchronization of the time point and the active spot with Mastodon. Furthermore, the “Advanced Visuals” view does not support the interpolation missing spots within a track.
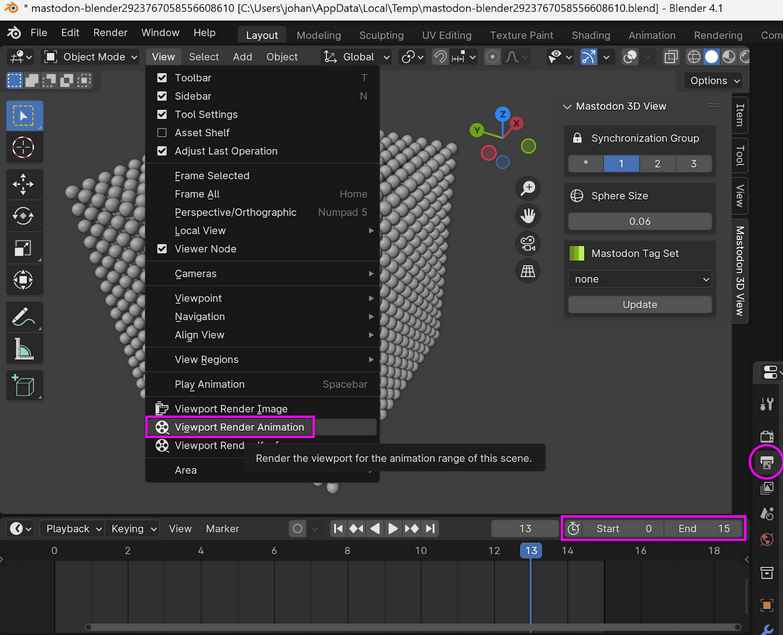
Rendering images and movies in Blender
A rendered image of the current 3D viewport view can be obtained using the View > Viewport Render Image command
located in the upper left corner of the 3D viewport. The resulting image can then be saved.
To render multiple frames, Blender’s Timeline editor can be used to set a Start and End frame, and these frames can be
recorded by executing the View > Viewport Render Animation command. Note that Blender’s
Output Properties can be adjusted to change the file save location (default: /tmp) and
the output format (default: PNG).
Example of a visualization of feature color modes
Example of a movie rendering created with the Blender View
Tracking data of phallusia mammillata embryogenesis by Guignard et a. (2020).
Templates for advanced visualizations
To further enhance visualizations and enable true rendering in Blender, users typically need to configure camera settings, adjust lighting, and optionally modify the provided and preset Geometry Nodes (in order to manipulate textures, sphere shapes, etc.). However, doing so requires some familiarity with Blender’s more advanced tools. To simplify this process, we provide an additional file, default_empty.blend file, which we used for advanced visualizations and high-quality renderings. It can be downloaded here: https://zenodo.org/records/15826991.
When using this file, multiple visualization options become available for spheres and tracks, respectively. These options can be accessed via the Modifier Properties panel (see Figure 7), located in the Properties Editor and highlighted with a pink circle. Clicking the icon expands the panel (see pink frame in Figure), allowing users to enable or disable spheres and tracks, adjusting Sphere Radius and Resolution, and modifying Sphere Displacement to create more deformed sphere shapes if desired. The Time Size Falloff option allows spheres to gradually shrink spheres over time. Additional parameters such as Track Length (incoming and outgoing), Track Width, and Interpolation Resolution can also be defined. An easy-to-use cropping functionality can also be accessed at the bottom of the panel.
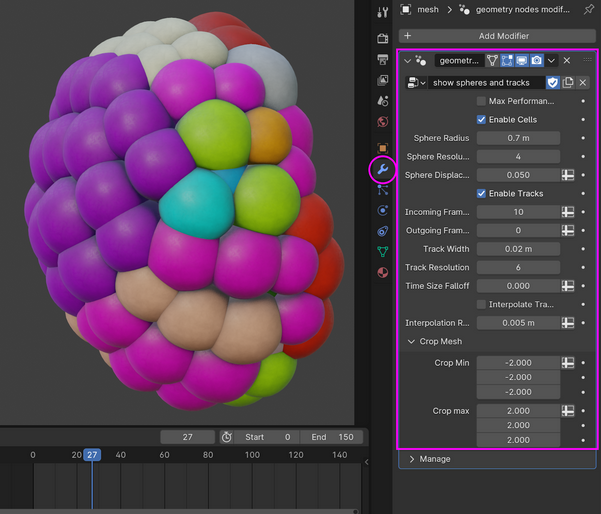
Visualization options provided by the custom ‘default_empty.blend’ file. The Modifier Properties panel (located in the Properties Editor and highlighted with a pink circle) can be expanded by clicking it. This panel (see pink frame) allows you to adjust the sphere size and subdivisions of spots, toggle track visibility, and modify track width as well as the number of frames shown before and after the current time point.
The final Blender scene manually adjusted by the user can again serve as a reusable template for other Mastodon projects by simply saving it with Blender (File > Save as). We recommend deleting the visualized dataset first to create an empty template for reuse. To do this, left-click the mesh in the 3D viewport, press the ‘X’ key, and confirm by selecting Delete. Alternatively, you can use a .blend file that already includes a mesh from a previous Mastodon project as a starting point. This allows you to add additional datasets to the same Blender scene. In this way, multiple Mastodon projects can be visualized and rendered together within a single file.
For a hands-on walkthrough of this procedural workflow — from importing the exported CSV to building cells and trajectory tails with Geometry Nodes and Shader Nodes and compositing the final render — see Samuel Pantze’s tutorial Visualizing Cell Trajectories from Mastodon in Blender.
Export CSV for Blender
Menu Location:
Window > Blender Views > Export CSV for BlenderExports the current spot data to a CSV file. The CSV file contains the spot IDs, the spot labels, the time point, the x, y, z coordinates, the radius of the spot and potential tag and feature values. The CSV file, which is created by this command, is the same file that is used with
Blender View (Advanced Visuals).To import the CSV file into Blender manually, the script read_csv.py can be used.